Next: EXAMINE, Previous: DESCRIPTIVES, Up: Statistics [Contents][Index]
15.2 FREQUENCIES
FREQUENCIES
        /VARIABLES=var_list
        /FORMAT={TABLE,NOTABLE,LIMIT(limit)}
                {AVALUE,DVALUE,AFREQ,DFREQ}
        /MISSING={EXCLUDE,INCLUDE}
        /STATISTICS={DEFAULT,MEAN,SEMEAN,MEDIAN,MODE,STDDEV,VARIANCE,
                     KURTOSIS,SKEWNESS,RANGE,MINIMUM,MAXIMUM,SUM,
                     SESKEWNESS,SEKURTOSIS,ALL,NONE}
        /NTILES=ntiles
        /PERCENTILES=percent…
        /HISTOGRAM=[MINIMUM(x_min)] [MAXIMUM(x_max)]
                   [{FREQ[(y_max)],PERCENT[(y_max)]}] [{NONORMAL,NORMAL}]
        /PIECHART=[MINIMUM(x_min)] [MAXIMUM(x_max)]
                  [{FREQ,PERCENT}] [{NOMISSING,MISSING}]
        /BARCHART=[MINIMUM(x_min)] [MAXIMUM(x_max)]
                  [{FREQ,PERCENT}]
        /ORDER={ANALYSIS,VARIABLE}


(These options are not currently implemented.)
        /HBAR=…
        /GROUPED=…
The FREQUENCIES procedure outputs frequency tables for specified
variables.
FREQUENCIES can also calculate and display descriptive statistics
(including median and mode) and percentiles, and various graphical representations
of the frequency distribution.
The VARIABLES subcommand is the only required subcommand. Specify the
variables to be analyzed.
The FORMAT subcommand controls the output format. It has several
possible settings:
TABLE, the default, causes a frequency table to be output for every variable specified.NOTABLEprevents them from being output.LIMITwith a numeric argument causes them to be output except when there are more than the specified number of values in the table.Normally frequency tables are sorted in ascending order by value. This isAVALUE.DVALUEtables are sorted in descending order by value.AFREQandDFREQtables are sorted in ascending and descending order, respectively, by frequency count.
The MISSING subcommand controls the handling of user-missing values.
When EXCLUDE, the default, is set, user-missing values are not included
in frequency tables or statistics. When INCLUDE is set, user-missing
are included. System-missing values are never included in statistics,
but are listed in frequency tables.
The available STATISTICS are the same as available
in DESCRIPTIVES (see DESCRIPTIVES), with the addition
of MEDIAN, the data’s median
value, and MODE, the mode. (If there are multiple modes, the smallest
value is reported.) By default, the mean, standard deviation of the
mean, minimum, and maximum are reported for each variable.
PERCENTILES causes the specified percentiles to be reported.
The percentiles should be presented at a list of numbers between 0
and 100 inclusive.
The NTILES subcommand causes the percentiles to be reported at the
boundaries of the data set divided into the specified number of ranges.
For instance, /NTILES=4 would cause quartiles to be reported.
The HISTOGRAM subcommand causes the output to include a histogram for
each specified numeric variable. The X axis by default ranges from
the minimum to the maximum value observed in the data, but the MINIMUM
and MAXIMUM keywords can set an explicit range.
6
Histograms are not created for string variables.
Specify NORMAL to superimpose a normal curve on the
histogram.
The PIECHART subcommand adds a pie chart for each variable to the data. Each
slice represents one value, with the size of the slice proportional to
the value’s frequency. By default, all non-missing values are given
slices.
The MINIMUM and MAXIMUM keywords can be used to limit the
displayed slices to a given range of values.
The keyword NOMISSING causes missing values to be omitted from the
piechart. This is the default.
If instead, MISSING is specified, then the pie chart includes
a single slice representing all system missing and user-missing cases.
The BARCHART subcommand produces a bar chart for each variable.
The MINIMUM and MAXIMUM keywords can be used to omit
categories whose counts which lie outside the specified limits.
The FREQ option (default) causes the ordinate to display the frequency
of each category, whereas the PERCENT option displays relative
percentages.
The FREQ and PERCENT options on HISTOGRAM and
PIECHART are accepted but not currently honoured.
The ORDER subcommand is accepted but ignored.
15.2.1 Frequencies Example
Example 15.2 runs a frequency analysis on the sex and occupation variables from the personnel.sav file. This is useful to get an general idea of the way in which these nominal variables are distributed.
get file='personnel.sav'.

frequencies /variables = sex occupation
            /statistics = none.
|
Example 15.2: Running frequencies on the sex and occupation variables
If you are using the graphic user interface, the dialog box is set up such that by default, several statistics are calculated. Some are not particularly useful for categorical variables, so you may want to disable those.
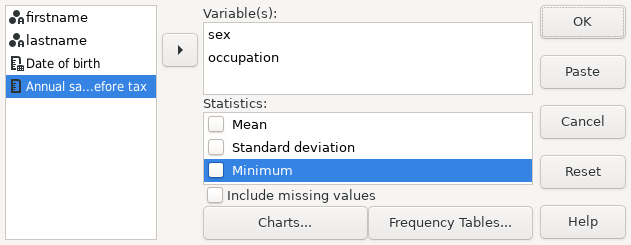 |
Screenshot 15.2: The frequencies dialog box with the sex and occupation variables selected
From Result 15.2 it is evident that there are 33 males, 21 females and 2 persons for whom their sex has not been entered.
One can also see how many of each occupation there are in the data. When dealing with string variables used as nominal values, running a frequency analysis is useful to detect data input entries. Notice that one occupation value has been mistyped as “Scrientist”. This entry should be corrected, or marked as missing before using the data.
| ||||||||||||||||||||||||||||||||||||||||||||||||||||||||||||||||||||||||||||||||||||||||||||||||||||||||||||||||
Result 15.2: The relative frequencies of sex and occupation